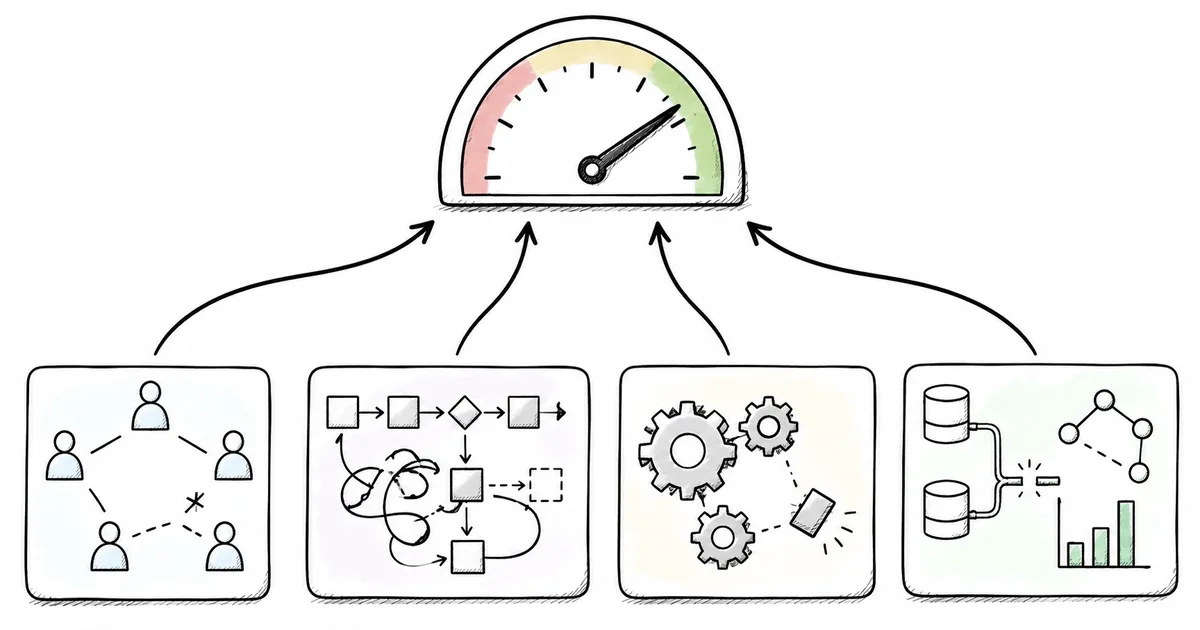
Martech benchmarks measure spend, headcount, tool counts, and utilization. None of them measures whether your team can operate the technology you already own, which is the variable that decides whether the stack performs.
Key Takeaways
- Martech benchmarks track inputs and activity, telling you what you bought and how busy the stack is, not whether it produces outcomes.
- A utilization score can't diagnose anything: low usage might be a skills gap, bad data, weak onboarding, or a tool you never needed.
- Maturity scorecards that grade skills record self-rated opinion, not whether the team can run the platform to a defined standard.
- Reality check: the number that predicts performance, operating capability, sits on no scoreboard, so you'll have to assess it yourself.
The martech industry runs on a shelf of trusted numbers. Budget as a share of revenue. Marketing headcount. The count of tools in the stack. The share of a platform’s features in active use. Leaders quote these figures in board decks and quarterly reviews as if they settled the only question that matters: is the marketing technology working?
They don’t settle it. Every one of those numbers measures what went into the stack or how busy it looks. None measures whether the people running it can turn it into results, and that’s the variable that decides performance.
What martech benchmarks count
Start with the spend surveys. They report marketing’s budget as a percentage of revenue and split it across labor, agency, media, and technology. Useful for planning. Silent on outcomes. A budget line tells you what you committed, not what you got back .
The headcount trackers have the same limit. They count bodies on the team, which measures size rather than skill. Twelve people who can’t operate the platform and four who can produce different results from the same figure on a chart.
The landscape reports count tools. Thousands of products, categories rising and falling, consolidation and sprawl. Real market intelligence, and no signal at all about whether any single team can run what it bought.
Why the usage number can’t diagnose anything
The one figure that looks like a performance measure is utilization, the share of a platform’s capabilities a team uses. It feels diagnostic. It isn’t. A low number could mean the team lacks the skills to activate the features, or the data feeding them is broken, or onboarding never happened, or the organization bought capabilities it never needed. One score, four unrelated causes, and no way to tell them apart from the number alone.
A percentage that lumps together skill gaps, data problems, and features you were right to ignore can’t tell you what to fix. I’ve split that number into its two honest directions, invest to close a capability gap or rightsize to shed complexity you don’t need, in Feature Utilization Is Two Problems, Not One . The benchmark reports the percentage. It never reports which direction you’re facing.
The scorecards grade opinion, not capability
A newer class of scorecard tries to fix this by grading the team directly. These add a people-and-skills dimension alongside platform and process, and they score it. Progress, on the surface.
Look at how the score gets produced. It comes from leaders rating their own organization: do we have the skills to use our systems, how mature is our team. A self-rating is a perception. It records what the CMO believes about the team’s capability, not whether the team can build a segment, configure a journey, or trace a broken data flow to a defined standard. Those are different measurements, and the space between them is where confident scorecards and failing stacks coexist.
The spending data shows the same gap from the other side. Marketing leaders now put 15.3 percent of their budgets into AI, yet only 30 percent say they’re ready to scale the capabilities they’re paying for (1. Gartner, 2026). Money is moving faster than the ability to use it, and a self-rated maturity grade smooths that over instead of exposing it. The constraint is rarely one thing. Training alone won’t move it when the structure around the team stays fixed .
Why the benchmarks stop where they do
There’s a reason the numbers cluster around spend and self-ratings. Those are cheap to collect. You can pull budget figures from finance, headcount from HR, and a skill rating from a survey question a CMO answers in thirty seconds. Operating capability resists that. Measuring whether a team can run its stack means watching real work over time, and no quarterly survey does that at scale. So the instruments optimize for what’s easy to gather, and the industry mistakes the easy number for the important one.
The number that would predict performance
Operating capability is the missing measure: whether a team can turn the technology it owns into repeatable marketing outcomes, and when it can’t, which constraint is the real block : people, process, data, or the tool itself. No standard benchmark isolates it. The scoreboards measure the inputs on one side and, sometimes, self-reported skill on the other, and leave the operating question in between unmeasured.
The evidence that it’s the variable that matters keeps arriving from outside martech’s own scorecards. EY’s 2025 global workforce study found that only 12 percent of employees get enough AI training to reach full productivity, and that the heavily trained group reported several times the weekly productivity gain of those who got almost none (2. EY, 2025). Capability investment moves output. Grant Thornton’s 2026 research found that organizations with fully integrated AI pulled far ahead of those still piloting on reported revenue growth (3. Grant Thornton, 2026). Integration and capability, not the purchase, separate the winners. A benchmark that stops at spend and usage can’t see any of it.
How to read the next report
Read the benchmarks for what they are. Spend surveys, headcount counts, landscape maps, and utilization scores are activity dashboards. They track the size and shape of the investment and the direction of the market, and they do that well. They were never built to tell you whether your stack works, and treating a rising benchmark as proof that it does is how a marketing organization stays busy and stays stuck.
The measure that would tell you, operating capability, you have to run yourself. Start by diagnosing the organization before the platform , not by chasing a number upward. And carry a sharper question into the next quarterly review than the one the scorecards hand you. Not how much of the platform are we using. Whether the team can turn what we already own into outcomes, and if not, what’s stopping them.
Frequently Asked Questions
What do martech benchmarks measure?
Is martech stack utilization a good performance metric?
What is operating capability in martech?
How do you measure whether your marketing team can run the stack?
References
- Gartner. (2026, May 11). Gartner 2026 CMO Spend Survey finds CMOs allocate 15.3% of marketing budgets to AI, but only 30% are ready to scale AI capabilities. Gartner Newsroom. https://www.gartner.com/en/newsroom/press-releases/2026-05-11-gartner-2026-cmo-spend-survey-finds-cmos-allocate-15-point-3-percent-of-marketing-budgets-to-ai-but-only-30-percent-are-ready-to-scale-ai-capabilities
- EY. (2025). EY Work Reimagined Survey 2025. Ernst & Young. https://www.ey.com/en_gl/newsroom/2025/11/ey-survey-reveals-companies-are-missing-out-on-up-to-40-percent-of-ai-productivity-gains-due-to-gaps-in-talent-strategy
- Grant Thornton. (2026). 2026 AI Impact Survey. https://www.grantthornton.com/services/advisory-services/artificial-intelligence/2026-ai-impact-survey